Sunday, May 29, 2011

Strategy actual expectancy uncertainty

Despite that any trading strategy, even with a high Expected Value and awesome looking historical equity curves, possible losses within a small sample (e.g. a few hundred trades) are expected. Of course there's also the chance that it does not really make money, and that the back test data simply got lucky. The same thing could happen with a conventional business failures where they may have started with awesome concepts, but with no empirical evidence.

So how do we deal with it? As Nassim Taleb has mentioned in Models on Models, practically profitable trading strategies often hold robust theory and have little dependence on probability estimate.

Purely statistics based trading strategies are dangerous.


 Pure number crunching does not reflect how markets evolve, and that financial distributions have consistently implied a pathological nature. This means we can NOT assume that bigger sample back test results converge to population statistics, i.e. great historical performance are really meaningless without robust principle explaining the inefficiency exploited.

Here's a simple applet from HQuotes showing possible equity curves with customized expected values, for a small number of bars(trades). We can see that unless you have a significant edge, short term performance really can not be trusted!


Tuesday, April 20, 2010

Quant skills


Let's look at some skills in demand today at Quant Finance Jobs. The employers are mostly hedge funds and the average salary: $200K USD + %PnL (Percentage of Profit/Loss).

"
1) Quant Trading Analyst-Algorithmic Trading Team-London

London, United Kingdom

Interested candidates should have extensive experience in the following;
• Time Series Econometrics
• Alpha Construction
• Bayesian Statistics
• Transaction Cost Modelling
• Black Litterman modelling
• Portfolio optimisation

2) Ultra high frequency Statistical Arbitrage Trader

New York, United States of America

Requirements:-

Candidates will have a background in the high frequency trading space, with experience creating and managing strategies with a high Sharpe Ratio, high ROC and holding little to no overnight positions.
3+ years experience of researching, back testing and deploying systematic trading strategies straddling multiple asset classes including equity index, currency, fixed income and commodities. Futures experience would be ideal.
Ivy League calibre PhD in a hard science

Strong to expert programming skills in C++.
Candidates should be innovative and analytical thinkers with strong communication skills.

3) High Frequency Quant Trader

New York or London, United States of America

Required Skills and experience
PhD from a top tier University in Computer Science, Mathematics, Statistics, Engineering or related subject
Strong hands on programming experience in C++
Experience with analytical packages such as Mathematica, Matlab, PyLab or R
Between 1-3 years experience of developing, implementing and trading high frequency trading strategies across any asset class.
Strong quantitative skills and experience
Passion for solving complex problems and drive to success

"
We can see that strong mathematics is a must, and computer science a close 2nd, or an ivy league PhD in a "Hard Science" (I'm thinking physics, statistics). So knowing what the hedge funds possess and utilize, how does the average private trader compete and survive, profitably?

Just some ideas
  • Invest time and energy to gain necessary skills to level the playing field
  • Find ways to quantify institutional buying/selling pressure (but risk being always a bit behind)
  • Raise enough money to influence and exploit the markets like Soros or Buffet
  • Hire a quant...

Monday, January 18, 2010

Key to winning poker


It's about finding the worst players possible. There I "solved" it. So much poker literature on the same probabilities, do-this-if-that stuff yet forgetting to mention the required difference in skill levels.


Since I play Fixed-Limit poker, playing against math-incapable players usually gets me a huge edge where I can play less-than-optimal strategies and still retain a positive expectancy. Therefore when I do play a numerically optimal game, so far the most profitable sessions have occurred with the lowest skilled players.

Friday, December 4, 2009

837% return in 33 days (Poker)


Smasharoo, a pro poker player, documented a return of 837% within 33 days, with very little volatility (adequate bet size management), at fullcontactpoker.com. That’s pretty amazing. I have learned a few things from his much appreciated shared experience.


Minimum volatility


Position size/bankroll management and playing strategy largely optimize return volatility. Basically, understand the statistics behind your strategy and make betting size decisions with respect to it for optimization. The Kelly Formula is a pretty good reference.


High frequency of compounding


This explains why successful day traders practically always outperform those holding longer positions. I have discussed that even with a small statistical edge; higher frequency of compounding makes a HUGE difference (see Slight Edge Butterfly Effect).


Poker and financial instruments


I see a lot of similarities. They both hold inefficiencies due to varying skill levels, i.e. more informed players will consistently profit over time. So the key then lies in becoming more informed, the part that requires diligence, critical thinking, and probably guts too amidst discouragement from fixed, traditional thinkers. Kinda cool huh!

Sunday, November 1, 2009

ARMA(p,q) forecasting


ARMA, or Autoregressive Moving Average, offers a relatively simple time series forecasting model. So what about non-stationary financial time series without much autocorrelation, would it perform well?


ARMA(p,q) basics

Forecasting model or process in which both autoregression analysis and moving average methods are applied to a well-behaved time series data. ARMA assumes that the time series is stationary-fluctuates more or less uniformly around a time-invariant mean. Non-stationary series need to be differenced one or more times to achieve stationarity. ARMA models are considered inappropriate for impact analysis or for data that incorporates random 'shocks.' See also autoregressive integrated moving average (ARIMA) model.

Source: Business Dictionary


Autoregressive Model, AR(p)

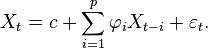
where are the parameters of the model, c is a constant and e is white noise. The constant term is omitted by many authors for simplicity.


Moving Average Model, MA(q)

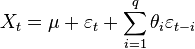
where the θ1, ..., θq are the parameters of the model, μ is the expectation of Xt (often assumed to equal 0), and the e, e,... are again, white noise error terms.

Source: Wikipedia


Some thoughts off empirical findings


As ARMA was created to address stationary processes, ARMA forecasting resulted much more reliably with percentage returns (of equal length time steps) instead of raw financial time series. Practical application for trading strategies could surface with more analysis of conditional error distributions. Reliability however remains an issue until conditional volatility management. Over all, this simple method presents some promising capabilities!

Friday, March 7, 2008

Statistical Expectancy


The world does not run on absolute certainty, yet the strategic decisions we choose affects future outcomes somehow. The irony seems amplified with those who understand little toward statistical expectancy. Having adequate grasp of this subject makes a more informed investor for any business or personal desires.


The concept is simple.

E = Expectancy

P(w)= Probability of winners

S(w)= Average winner Size

P(l)= Probability of losers

S(l)= Average loser size

E = [P(w)*S(w)]–[P(l)S(l)]


E.g. let’s look at New Zealand finance companies. They pledge to provide retail investors a slightly above the government bond interest rate as long as their own investments do not experience corrections or draw-downs. Historically speaking, credit markets have a positive correlation to the general economy, and the world has experienced at least 2 years of recession each decade, or 2 out of each 10 years. From this we can conclude that these companies will not end every single year profitably.


I.e. the rough probability of a losing year is then 2/10=0.2 or 20%, and the probability of them ending each year profitably stands at 1-2/10=0.8 or 80% at best. They offer retail investors annual rates of roughly 9.x% (I’ll round it up to 10%) in the years they make performance targets, and in a bearish year the average investor looks to take a loss of 30% to 70%, averaging 50%.


So can the average retail investor “expect” to profit over the long run using these companies?

Probability of a profitable year: (80% or 0.8)

Average investor profit: (10% or 0.1)

Probability of a bad year: (20% or 0.2)

Average investor loss: (50% or 0.5)

E= (0.8)(0.1)-(0.2)(0.5)

E=0.08-0.1

E= -0.02


A negative expectancy suggests a net loss will likely occur in the long run. In fact the average roulette player has a less negative expectancy than the above; in other words you would likely lose less money playing roulette at the casino than investing with the finance companies.


To make profit or receive greater reward consistently, you need the odds on your side. Having a positive expectancy remains one of few ways to verify that. So learn the math, and make wiser decisions.