Day Trading with Short Term Price Patterns and Opening Range Breakout
Wow somebody uploaded the whole book,
Toby Crabel - Day Trading With Short Term Price Patterns and Opening Range Breakout
4 months ago
Wow, somebody must've made a killing off this. Another example of passing market inefficiency exploited by smart money.
This was part of a course I took at university. R is quite user friendly, efficient on system resources, and pretty useful! Below you'll find commands for some basic statistics along with their explanations and examples.
Topics included:
Basic stats, Cross Correlations, Cointegration, GARCH( Generalized Autoregressive Conditional Heteroskedasticity), ARIMA (Autoregressive Integrated Moving Averages), VAR (Vector Autoregression), and linear single/multiple regression.
(Paul is a great guy)
Lecture Notes
Some of the folks at university probably think I'm crazy to spend time on all this non-school related material when final exams are next week... Any way, this was a pretty good, i.e. useful book for a couple of writers with backgrounds in academia. Some of the ideas were practical in real time trading for me, especially the stuff around conditional correlations, seasonal volatility, and rolling regressions.
The good
Lots of descriptive concepts around data analysis, modeling, and trading strategy development. Some of the ideas like normalizing returns via mapping operators to take care of the skew issue with correlations could definitely help improve the trading algorithm development process. The summarized stylized facts could help any new reader become familiar with general statistics of high frequency financial time series.
The less-than-good
It felt like they might have made some things a bit more complicated than necessary.
Over all assessment
It's got some good ideas.
ARMA, or Autoregressive Moving Average, offers a relatively simple time series forecasting model. So what about non-stationary financial time series without much autocorrelation, would it perform well?
ARMA(p,q) basics
“
Forecasting model or process in which both autoregression analysis and moving average methods are applied to a well-behaved time series data. ARMA assumes that the time series is stationary-fluctuates more or less uniformly around a time-invariant mean. Non-stationary series need to be differenced one or more times to achieve stationarity. ARMA models are considered inappropriate for impact analysis or for data that incorporates random 'shocks.' See also autoregressive integrated moving average (ARIMA) model.
“
Source: Business Dictionary
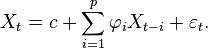
“
where are the parameters of the model, c is a constant and e is white noise. The constant term is omitted by many authors for simplicity.
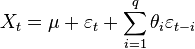
Moving Average Model, MA(q)
where the θ1, ..., θq are the parameters of the model, μ is the expectation of Xt (often assumed to equal 0), and the e, e,... are again, white noise error terms.
“
Source: Wikipedia
Some thoughts off empirical findings
As ARMA was created to address stationary processes, ARMA forecasting resulted much more reliably with percentage returns (of equal length time steps) instead of raw financial time series. Practical application for trading strategies could surface with more analysis of conditional error distributions. Reliability however remains an issue until conditional volatility management. Over all, this simple method presents some promising capabilities!

US bank large-loan (>$20Million) losses have reached $53Billion USD in 2009, according to Yahoo Finance AP.
"
The report said total identified losses of $53.3 billion in 2009 surpassed last year's total of $2.6 billion, and nearly tripled the previous peak in 2002, when losses totaled $19.1 billion...
While the economic downturn was first pegged to residential mortgage loans, banks and lenders are now having problems with commercial real estate...
"
So... what about the derivatives like CDOs and CDSs riding on these loans? If a paltry $2.6Billion loss wrecked such havoc in 08, what the heck will $53Billion unleash, eternal damnation?!
Keep in mind the S&P500 remains quite over valued, PE ratio at Aug 31st 09: 129.19

CNN Money mentioned this today.
"
'It's not a very complicated story,' said Charles Biderman, who runs market research firm Trim Tabs. 'Insiders know better than you and me. If prices are too high, they sell.'
"
Interesting how mainstream news hasn't stressed this little noteworthy detail. Sooner or later, volatility will jump again.
Roulette, with a paltry 1/37, or 2.7% edge, makes casinos serious profit over time, financial trading sits on very similar ground. Having a statistical edge does not necessarily result with positive expectancy, though it definitely helps. This calls for an empirical test.
Empirical analysis
Forecast Model- Multilayer Perceptron Neural Network
Input/Predictive Variables- Various commodity and Dow Jones indexes
Output/Dependent Variable- Next Day Return of the S&P500 Index (Next Day Open price – Next Day closing price)
Training Period- from Jan. 2002 to Jan 2005
Test Period- from Jan 2005 to Aug. 2009
Focused only on next-day direction, the predicted values offered a winning rate of just about 54%. Keep in mind this stands quite superior to the roulette casino edge. Then out of curiosity, I wanted to see how hypothetical trades off these forecasts would have resulted, basically buying/shorting at the open and liquidating positions at the NYSE close. Virtual trading equity starts at 1, or 100%, and would compound daily, winning or losing. See chart below.

I know- it’s pretty cool, 400% plus return in roughly 4.5 years. It also appeared that the mid 2007 volatility jump pushed performance up tremendously. This brings the thought that maybe with volatility based position size adjustments; return over time could become smoother and even higher. Imagine what a higher hit rate could achieve…

According to Warren Buffet (The Snowball), while technological novelty has advanced mankind in general, its investments usually end badly. He mentioned some empirical evidence of this at a private talk, from cars to airplanes.
Cars and planes
They are no doubt a couple of seriously significant inventions from the last century. Around 2,000 car companies existed at one time, and out of those, only a handful (Ford and sort of GM?) stands today. The rest have pretty much all gone belly up, taking shareholders down (enriching short sellers).
No single air travel business has generated greater-than-actual-rate-of-inflation returns for its investors, notably the ones who have gone bankrupt. Given that business schools, parents, and TV preach creativity, industrial revolutions and stuff, naturally the question comes, “what gives?”
Good ideas still have limits
Management conflict of interest, miscommunications, competition, idealistic albeit inadequate budgeting, are but some profit making hurdles an innovative product/service idea itself can not overcome. Another point from Buffet, as these “new technology” firms push for esoteric products/services, the complexity in estimating their actual, intrinsic value does nothing but increase UNCERTAINTY.
The negative correlation between VIX and major stock indexes advocates that uncertainty leads to price drops. It is pretty clear cut, and again mainstream belief took the wrong side.

Robert Schiller at Yale Department of Economics updates the above, an inflation adjuted S&P500 earnings value. This explains the presently extraordinarily high P/E value of 140+. Simply unprecedented.
Some propose the Federal Reserve interventions lately have upheld the bubble despite the deteriorating economy, evidenced with GDP at -3.9%, inflation at -2.1%, and escalating Jobless Claims (tradingeconomics.com). Sooner or later, reality will set in and the horrifying mean reversion will come.
It will take place with either extreme inflation, dramatic equity price drops. Given that inflation stands negatively today, the decline will probably occur first, then the dollar crisis. Nice to have some excitement to look forward to, huh!
This is from the StandardAndPoors.com
Things look pretty shaky from here.
| S&P 500 Exchange Representation As of July 31, 2009 | ||
| Number of Cos. | % of Market Capitalization | |
| NYSE | 411 | 80.7 % |
| NASDAQ | 89 | 19.3 % |
| AMEX | 0 | 0.0 % |
S&P 500 Statistics As of July 31, 2009 | |||
| Total Market Value ($ Billion) | 8,660 | ||
| Mean Market Value ($ Million) | 17,319 | ||
| Median Market Value ($ Million) | 7,096 | ||
| Weighted Ave. Market Value ($ Million) | 71,956 | ||
| Largest Cos. Market Value ($ Million) | 343,483 | ||
| Smallest Cos. Market Value ($ Million) | 712 | ||
| Median Share Price ($) | 30.050 | ||
| P/E Ratio* | 143.95 | ||
| Indicated Dividend Yield (%) | 2.18 | ||
The stochastic calculus based interpretation of stock returns offers a glimpse of institutional perspective and indirectly reveals how buying and holding leads to a negative expectancy. While numbers and symbols may look intimidating initially, they tell a very simple story.
Variable definitions
The excerpt comes from Stochastic Calculus for Finance Vol1.

S0: Stock price at time step 0
S1: Stock price at time step 1
r: risk free interest rate (usually off treasury debt)
S1(H): Stock price at time step 1 if “heads” were to occur off a random coin toss
S1(T): Stock price at time step 1 if “tail” was to occur off a random coin toss
p: probability of H occurring
q: probability of T occurring
u: multiple applied to S if H occurs (e.g. S1(H) = 2S0)
d: multiple applied to S if T occurs (e.g. S1(T) = 0.5S0)
Note: p + q = 1, so they are collectively exhaustive
Formula 1.1.8 displays “expected” probabilities for future price moves.
Slower than actual rate of inflation
The expected returns adjust simply with r. The “risk free” (questionably) debt instruments usually offer the lowest of interest returns compared to institutional, private loans. As way more money becomes created via institutional and private borrowing, the actual rate of inflation is naturally greater than whatever return off government debt.
Credit risk ignorance makes the model impractical
The binomial pricing model assumes all listed companies to operate with infinite lifespan. Is this belief viable for actual money management? I’d say not. By the way this also invalidates general portfolio theory, sorry Markowitz!
While some revealed, many issues remain to be addressed with quantitative financial theories. Until academic ideas become aligned with empirical evidence, traders must search out personal, unique ways to remedy quantitative model weaknesses to become/remain profitable.


Many successful full time, professional traders engage entire days on one or two stocks or futures exclusively. No matter how little of an edge this practice offers, learning traders should grasp and take up whatever is available.
Floor Traders
On the exchange floors, the same traders engage in the same security day in and day out. This means that over time, their behavior could display patterns and therefore exploited by the retail trader who spends all his/her time on the associated stock or future.
Reduced Transaction Costs
This should be obvious. Operating a successful business requires expenses to remain at the absolute minimum, and so does trading on a professional level.
Reduced Mistakes
Everybody makes mistakes, and they cost money, at least in the amount of transaction fees. Volatility measure errors, fat finger mistakes like buying instead of shorting or keying in the wrong order volume become rare once the trader becomes familiar with the security.
Diversification Is Obsolete
The permanently optimistic analysts on TV or radio still scream about the well aged concept of diversification. The whole idea was created by an academic, not a professional security trader, decades ago. The highly correlated environment today, along with the credit contraction have created risks that were entirely overseen or intentionally ignored to deceive the public.
Either way, logical, profitable solutions always lie within something that the masses do not realize or engage in. At this moment, majority of the publicly uninformed still embrace the concept of “diversified portfolios” to reduce risk; didn’t turn out that way though for the past year, did it?


The NYSE TICK (ticker symbol ^tick at prophet.net or $tick at stockcharts.com) gives a net difference between stocks moving up against those on the decline, and it could help provide an edge for short term traders. As this indicator moves in a mean reverting fashion, interim emotional buying and selling become easier to identify.
Applying TICK for profitable trading
Naturally, you want to buy if TICK closed at extremely low levels the previous day, and vice versa. However there is more, and I will provide an example for a buying opportunity.
Alongside a low TICK value, this usually means below -800 for me, price action also matters. If accompanied by a dip in the indexes, then an opportunity is present for a buying entry. On the open of the next day, get in ONLY if price opens below the close of the previous day.
The opposite works for short positions. This scheme provides a slight edge for the learning trader. If liquidated at the end of the days, these theoretical opened positions would have all ended profitably for the past two months on the SPY (see above graphs). Yes it takes a heck of a lot of patience to trade it, well at least it would help your trading performance in the positive while the search for high returns goes on.
In this episode, they attempt to trade a tech stock and make pretty much all the newbie mistakes in a light hearted manner, notably the lack of entry/exit strategies, and allowing emotions to take hold. The show is hilarious.
Part 1
Part 2
Part 3

Now that I have described pair trading, the next topic of interest lies in “risk-free” arbitrage strategies. Due to generally limited literature, this subject remains heavily veiled behind institutional trading.
Classical arbitrage defined
Classical arbitrage applies to any business strategy where one exploits market inefficiencies for a risk-free, self-financed profit. Discrepancies in offered values of same underlying commodities/services present the said “market inefficiencies”.
I had provided some examples a while ago on the blog. They present some direct and practical business models or trading schemes applied by real life people.
Are they really entirely risk-free?
No, but it takes much less effort to control the risks arbitrage strategies face, as profitable trades occur regardless of market movement or volatility exposure. In other words, common risks associated with naked stock positions disappear.
Liquidity, price impact, and transaction costs (associated with transaction sizes) generally become manageable via adequate calculations. Mathematical finance helps to optimize arbitrage strategies via things like linear programming or vector space representations, but to become basically profitable (just not maximized), anyone with basic algebraic understanding can manage it.
Do you need huge capital to apply arbitrage strategies?
No. Many opportunities exist for traders of all levels of account sizes. Though of course the larger the trades, the more insignificant transaction-costs become which makes rewards more attractive.
Quick example:
(Hypothetical prices)
· At NZSX: $10.00NZD/share
· At ASX: $10.50NZD/share
You sell 300 shares short on the ASX (requires $3,150 cash in account), then buy 300 shares of the stock long on NZSX. When prices converge you close both positions.
· Total initial cash requirement: $6,300
· Total profit: $150
· Total transaction cost (at $30/trade): $120
· Total net profit: $30
At $30/trade, the brokers here charge way too much, hence making arbitraging in this manner not-so-attractive.
So, with a few thousand dollars, anyone can make money in these markets regardless of market movement.
Reasons why not all traders apply these strategies
Some simply do not understand it or never bothered looking it up. Then for others, the returns remain too low. While arbitrage strategies offer double digit returns per year with very low-risk, ambitious traders aim for much higher targets.
Exceptionally high returns require strategies of highly active management and innovation. Though once found, the mentioned arbitrage models do not look attractive anymore. I have met traders who make over 1% per day, consistently, so yes it is all possible.

Long term investors could produce increased return (or lessen the same amount in losses) from selling call options. The concept of derivative trading may intimidating some learning investors, just read on and I will show you why this works and carries very-low risk.
Call-Option Basics
A Call-option gives you the right, not obligation, to purchase the underlying stock at the strike price; a Put-option does the opposite but right now we only take interest in Calls. Each option contract (according to CBOE regulation) carries 100 shares of the underlying stocks.
So, trading 1 contract of IBM Call-option gives you the right to purchase 100 shares of IBM at the strike price before the option contract expires (usually 3rd Friday of expiration month). The value of traded option contracts is termed the “premium”, the price that option buyers pay, and option writers receive.
(The most renowned option exchange today operates at CBOE, Chicago Board of Option Exchange. They provide a brief and concise primer on options. Spend half an hour on it and you will understand all the fundamentals.)
Out-of-money Call-Options
The option “money-ness” describes the relationship between the strike price and underlying value. For Call-Options, this means a strike-price higher than the underlying price, e.g. holding an IBM call-option contract with strike at $110 while IBM sells at $105/share. The premium decreases to zero for out-of-money options at expiration.
Writing Out-Of-Money Call-Options
When you write a contract of Calls, you become obligated to sell 100 shares of the underlying stock at strike price IF assigned (this happens randomly, and infrequently according to statistics). This naturally requires tremendous risk management if you do not own shares of the underlying. However if you do hold sufficient underlying stock positions (i.e. covered), this tactic could prove very worthwhile.
Detailed Example
Let’s say you own 100 shares of QQQQ (closed at $44.28 on 4/11/08). You could consider selling a contract of Calls with strike price ≥$45 expiring in May. Last quoted Bid for a $45 Call stands at $1.16, and you decide to write 1 contract.
The following possibilities will ensue for the 3rd Friday of May.
1. QQQQ lowers in value to say, $41/share, and you lose $328 on the ETF position and the options expire worthless. Due to premium gained on the written Calls; you reduce that loss by $116.
2. QQQQ remains at the same price of $44.28, and you made no return on the stock position, and the options expire worthless. With the premium earned, you make a risk-free profit of $116, roughly 2.6% of the underlying position.
3. QQQQ increases to say, $48/share, and you gain $372 on the ETF position, lose $300 on the written option position (IF assigned), and end with a net profit of $72. Yes in this case your profit could become lower; nevertheless it is still about “taking profit”, not a loss.
So, this scheme reduces risks and increases your probability of success (2 out of 3 net-profitable potential scenarios), and you can pull it off easily. Pretty good, huh!
Several means remain available today to avoid or minimize risk involved with business failures for the equity holders. According to business survival statistics I had listed in the past (Stock Market Downside Bets), it moves below 50% after five years of operations. Managing this form of risk is crucial for the long term bullish investors.
Exchange Traded Funds
Making mutual funds obsolete, these listed baskets of goodies have become available to the general public with a variety of underlying stocks or commodities without the hefty management fees. The commodity ETF’s such as silver, gold, or oil pose virtually no risk of bankruptcy outside of the expected volatilities.
Insider Transaction Analysis
If the insiders have expressed way more volume in selling than buying in the past few months, it means they believe the price will likely dip. Since they always know more about the business operations than the public, their sentiment usually carries some weight.
Investment of Short Positions Exclusively
This would allow the investor to reap exceptionally large rewards off corporate disasters. It usually couples with heavy volatility, e.g. Bear Stearns stocks had gone from $54 to $3 over a single weekend this month (Mar. 08). A statistician speaker at the Auckland University of Technology had mentioned that one in four corporations experiences a calamity that it will never recover from, every 5 years.
This type of investment naturally completely mitigates the risk of loss from business failures, and carries a positive statistical expectancy. But it carries unique forms of risks and takes a much more active management to pull off.
Basic Options
If bullish, a basic position in a call option or leap would allow for unlimited profit potential, yet limited loss due to lowered cost of the option contracts. Of course, the game with options compared to underlying stock/commodity trading resembles that of chess with checkers. A whole variety of strategies exist to profit off underlying price or volatility swings. The serious investor would find value learning about options.
Final Words
As shown, it all simply takes a bit of research and discipline, and average investors can preserve capital, mitigate financial misfortunes. Like everything else good in life, a little bit of diligence could go a long way.

Long investment positions of corporate common stocks carry inherent risks. Advisers, agents like to avoid this subject as it requires more profound considerations via the client investor, and understanding it would reveal the often unjustified entry-costs and management fees.
Risk of General Market Downturn
The stock markets have a positive correlation to general economic swings, and wield at least a couple of bearish years each decade. This leaves the probability of stock markets ending each year at higher levels of 70-80% at best. The industry analysts, advisers or brokers facilitate public ignorance of this easily in bullish periods, where any stock seems to rally effortlessly with the illusion that no forms of risk exist.
Realistically, just the opposite is true. The longer a certain stock has rallied continuously, the more likely institutional holders look to take profit (i.e. sell) before the bearish period commences, or perhaps they know something that the public does not. Of course they need chumps to provide liquidity and buy off them, the role usually played by the general public; this is where the financial advisers and brokers do their magic and sell the “risk-free” sentiment, where “Of course it’ll go up!”
Risk of General Volatility Even In Bullish Periods
Prices do not move in nice smoothed curves, but rather ugly zigzags as result of constant quasi-auction based trading on the exchange floors. Even in a bull market, the general fluctuations occur and the simple attitude of ignoring this risk and “focus on the far horizon” typically ends in mediocre or terrible performance.
Accurate assessment of potential loss due to volatility could require a lot of number crunching, but simple methods exist as well. The ATR, or
Risk of Corporate Bankruptcy
Stocks from Enron or WorldCom had performed well in the bull market of the 90’s, and their demise never appeared obvious until the selling began. This risk always exists in long term long side stock investments, and it increases with length of holding period.
In other words, longer held stock positions carry higher risk of losing close to 100% of the associated value according to historical statistics. Longer held short positions face higher risk of getting squeezed short, i.e. the original lender of the shares demand them back, but even that has a lower loss potential than the upside bets.
Consistent Investment Profit Takes Work
Solutions exist to mitigate or limit the above mentioned risks. Taking short positions, applying market-neutral strategies, arbitrage schemes are some of the many options available to the retail investors. Investment managers who does not acknowledge or disclose these issues imply incompetence or dishonesty, and probably do not deserve the hefty fees.
It takes dedicated self-education, then planning and flawless execution to win in this game. Like many other good things in life, complex, but not impossible. I will discuss some of these solutions in a future article.