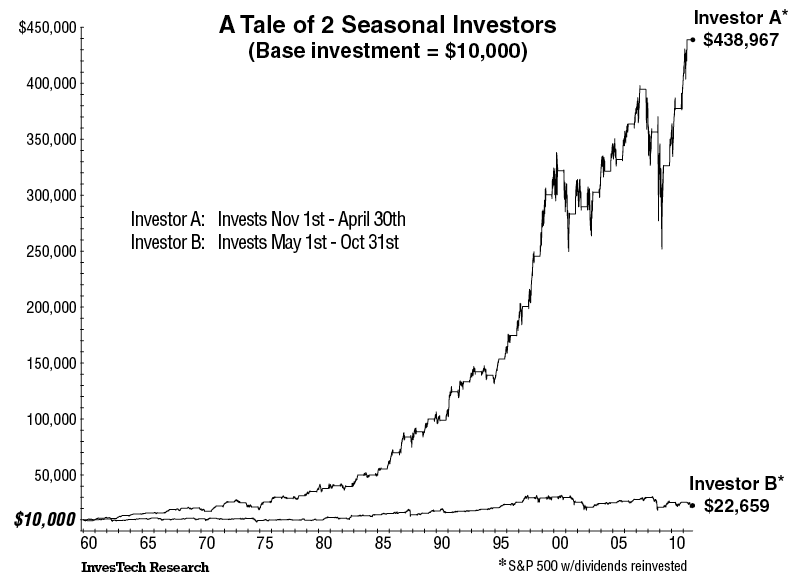
Here's the historical performance at The Big Picture

We can see that the Nov- April periods have been relatively volatile, too. A more important question remains, will this pattern stay in the future?
Dangers
It is dangerous to assume that this pattern would persist into the future, without a robust fundamental theory. Statistically speaking a sample size of 50~ means nothing. From my experience, there's no such thing as "statistically significant" with financial time series. A tradeable edge requires solid fundamental theory.
What this pattern CAN be used for
Sales at brokerage firms in November.


0 Reflections:
Post a Comment