The implied skew index provides a point of reference for the S&P500 implied volatility smile.
Ever wonder if the far out-of-the-money (OTM) puts are relatively cheap or expensive with respect to at-the-money (ATM) options? Or how accurate it is at forecasting actual skewness of future SPX returns? Historical Skew Index Data is now freely available to answer these questions.
Here is a glimpse of the implied skew along with Realized Skew of SPX returns since 2001.
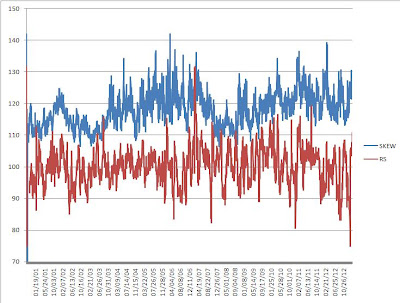


